What Is Gamma Exposure and How To Trade It
Gamma Exposure might sound complex, but it’s actually a powerful way to identify where institutional money is placing its bets in the options market.
Let’s break it down:
What is Gamma Exposure?
When traders buy and sell options, market makers take the opposite side of those trades. Their role is to provide liquidity and hedge risk.
For example, if you buy a call option (positive delta), the market maker takes on negative delta.
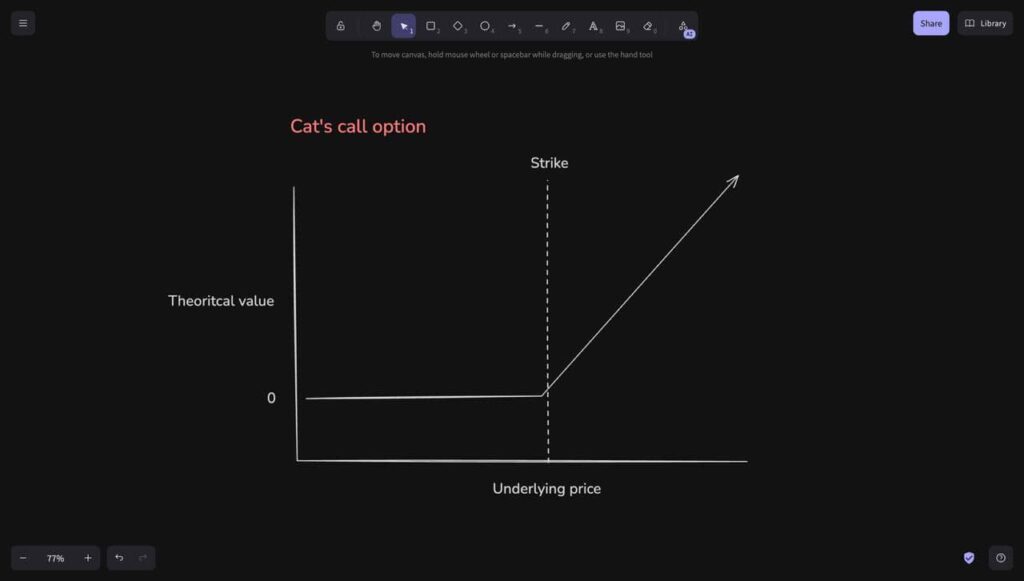
To stay neutral, they hedge by buying the underlying stock. This hedging activity—buying or selling stock—directly influences price movement.
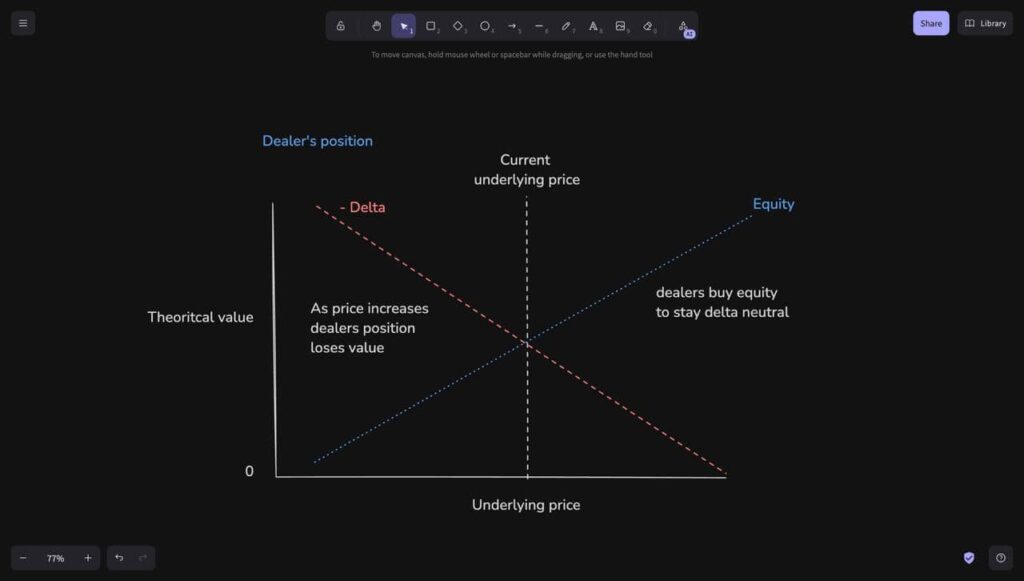
Gamma Exposure measures the strength and direction of that influence. Negative gamma results in more volatile price swings, while positive gamma leads to smoother, more controlled movements, often associated with bullish conditions.
How to Trade Using Gamma Exposure with Gextron
To capitalize on gamma exposure, traders can use the behavior of market makers to anticipate price reactions. Gextron simplifies this process by visualizing gamma data in an actionable format.
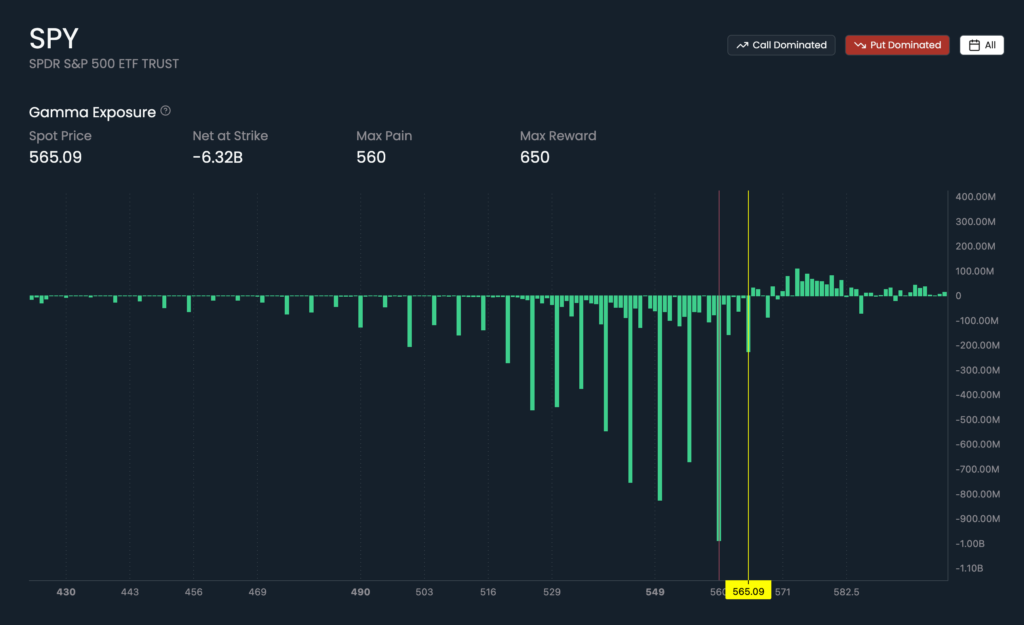
Key Levels to Watch:
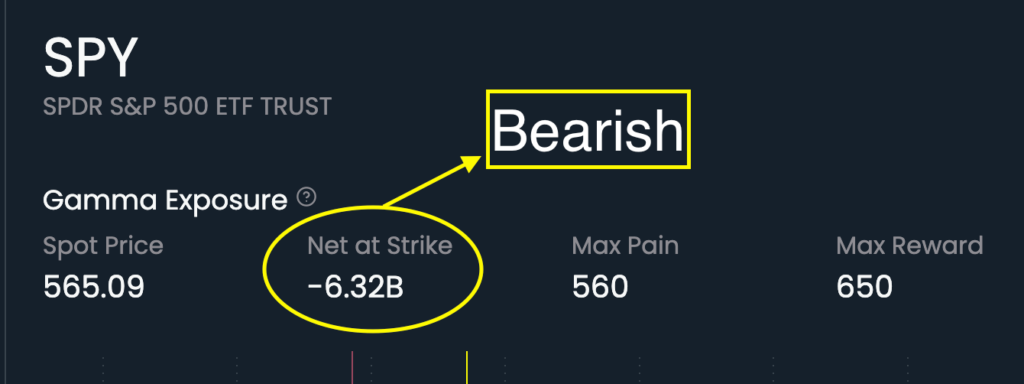
- Max Pain: The strike price with the tallest negative bar. This level often acts as strong support or resistance. For instance, in the SPY chart, Max Pain appears at 560. In a negative gamma environment, this can be a potential bounce zone.
- Max Reward: The level with the tallest positive bar. In the example, it’s at 650. If price approaches this level in a bullish context, it may act as resistance—or trigger a breakout.
- Areas of Interest: Other prominent gamma spikes that act as support and resistance. Gextron highlights these clearly so you can mark them on your chart.
N-Trans and P-Trans Levels:
- N-Trans: The first negative gamma bar, marking a shift toward bearish sentiment. Everything to the left of this strike tends to reflect put-dominant behavior.
- P-Trans: The first positive gamma bar, signaling a shift toward bullish sentiment. Everything to the right shows increasing call dominance.
Understanding these levels gives you insight into market structure and potential turning points.
Interpreting Gextron’s Gamma Data
On the right side of the Gextron chart, you’ll see numbers that represent how much market makers need to buy or sell if price moves 1%. Hovering over a strike displays the “Net at Strike,” which reveals gamma pressure at that level. Without hovering, you’ll see the total gamma exposure for the security.
In the SPY example, the total gamma exposure is -6.32 billion dollars—a strong negative reading that implies high volatility and increased downside risk.
Building a Trade Plan
Start by identifying the major gamma levels: Max Pain, Max Reward, N-Trans, P-Trans, and any areas of interest.
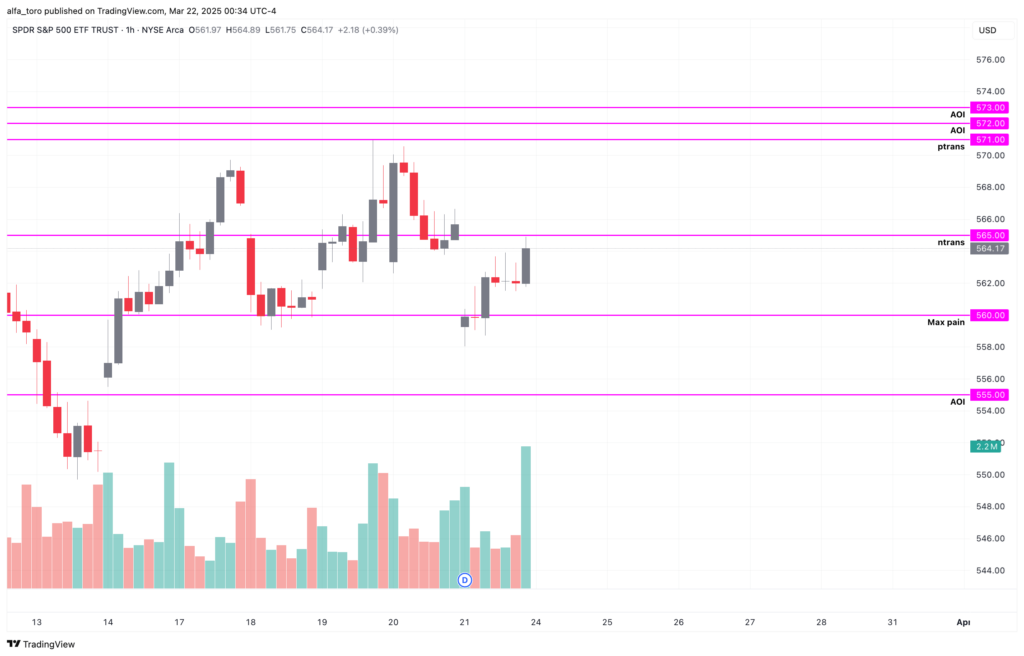
Then, assess the current sentiment:
- If total gamma exposure is less than -3 billion, the environment is biased to the downside.
- If it’s more than +3 billion, it’s biased to the upside.
- Between -3 and +3 billion, expect sideways or choppy price action.
Context is crucial. Consider where price is coming from:
- If bouncing off Max Pain and heading toward N-Trans, N-Trans may act as resistance.
- If falling from Max Reward toward P-Trans, P-Trans could act as support.
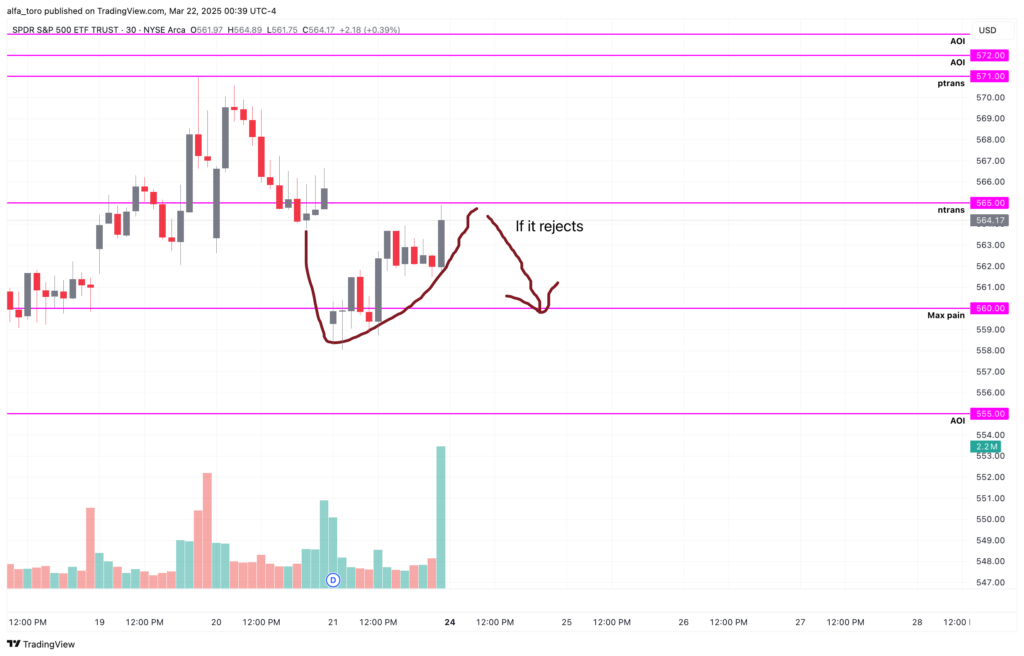
From there, your job is to play level-to-level:
- Max Pain to N-Trans
- P-Trans to Max Reward
- Area of interest to area of interest
If price breaks through one level, aim for the next significant level. This structured approach helps you avoid emotional decisions and keeps your trading focused on high-probability setups.
Why Gextron?
Gextron automates the heavy lifting by analyzing real-time option flow and surfacing key gamma levels. You no longer have to manually calculate support and resistance from scratch—it’s done for you. Use this data to form smarter entries, exits, and risk management plans.
With a clear view of gamma exposure and how market makers are likely to hedge, you can trade with confidence and precision.